How the bite forecast works
Rybalka Club tells anglers when the fish will bite. No black box: it’s a transparent, weighted heuristic over real weather data — and it’s honest about what science backs and what’s just folklore. Here’s exactly how I built it.
Two numbers, honestly computed
The forecast is two things: one score for the day and place, and one activity level per fish species. Both are shown with the factors behind them — nothing hidden.
The bite index (0–100)
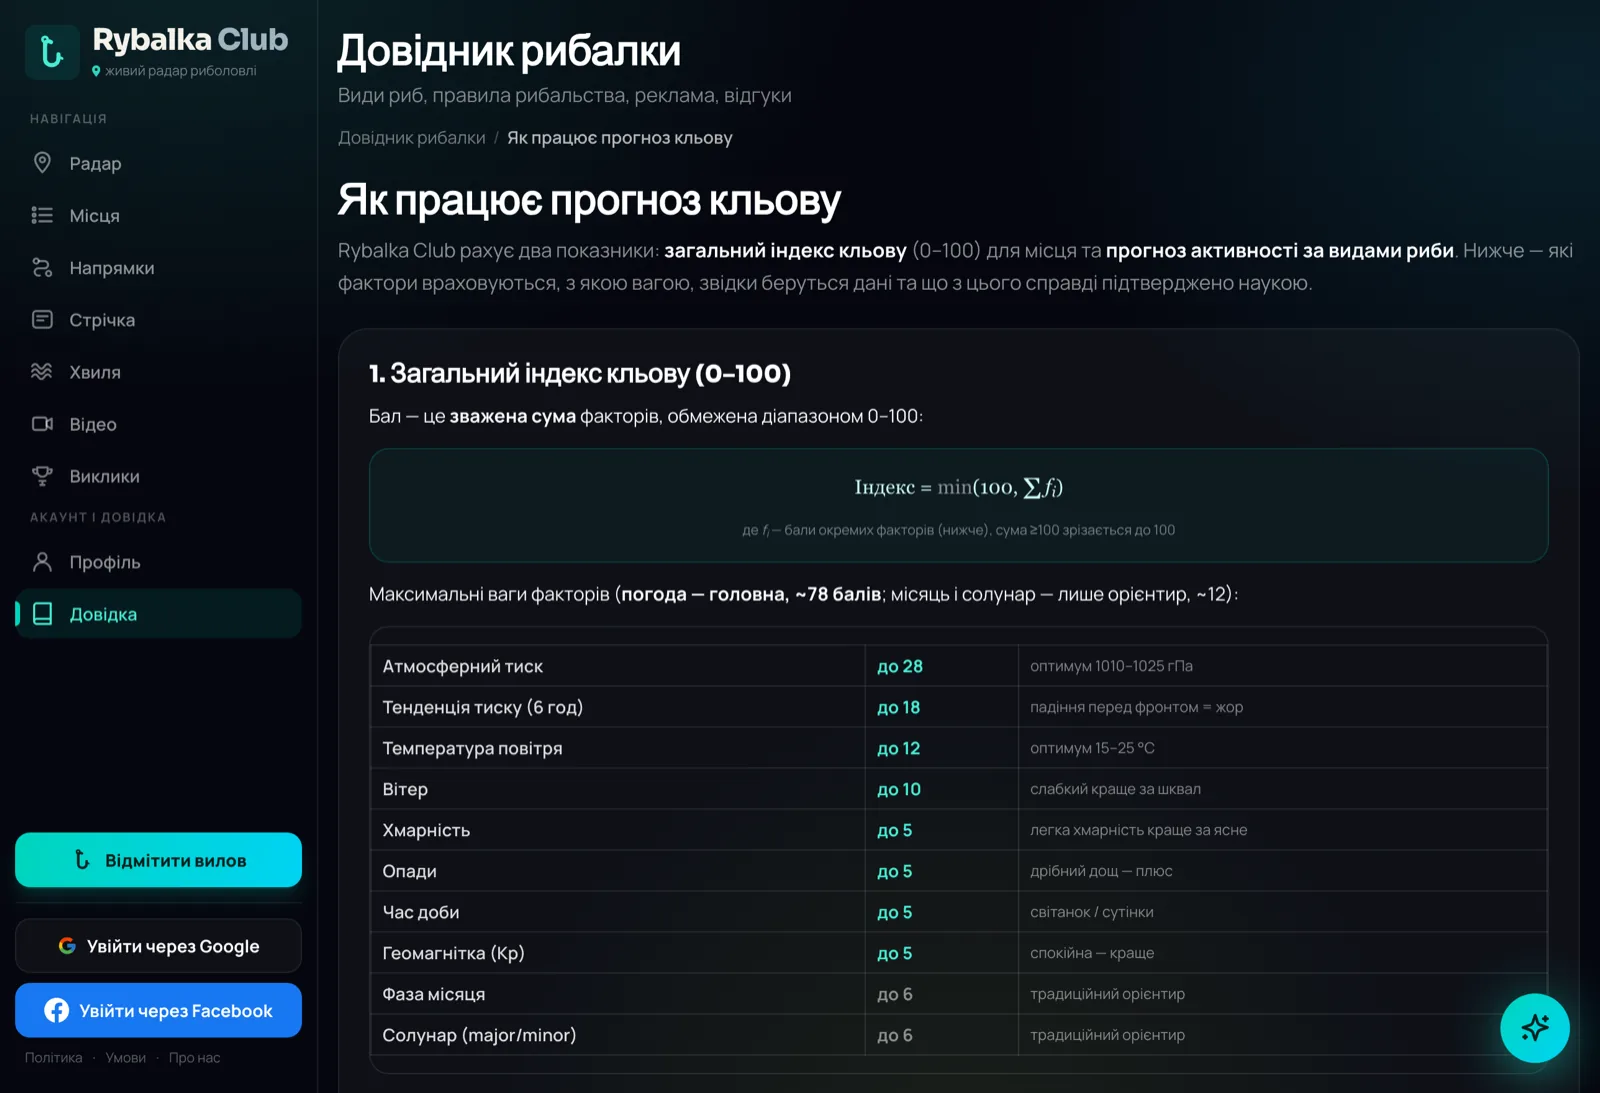
The daily score is a weighted sum of factors, capped at 100. Weather does the heavy lifting (~78 points); the moon and solunar periods are only a nudge (~12).
The strongest block is pressure and its trend (46 points) — fish switch on when pressure moves ahead of a weather front.
Per-species activity
On top of the day’s index I apply two multipliers, individual to each species — so on the same day a pike and a catfish read differently:
- tempFit — how close the water temperature is to the species’ optimum (pike likes it cool, carp and catfish warm).
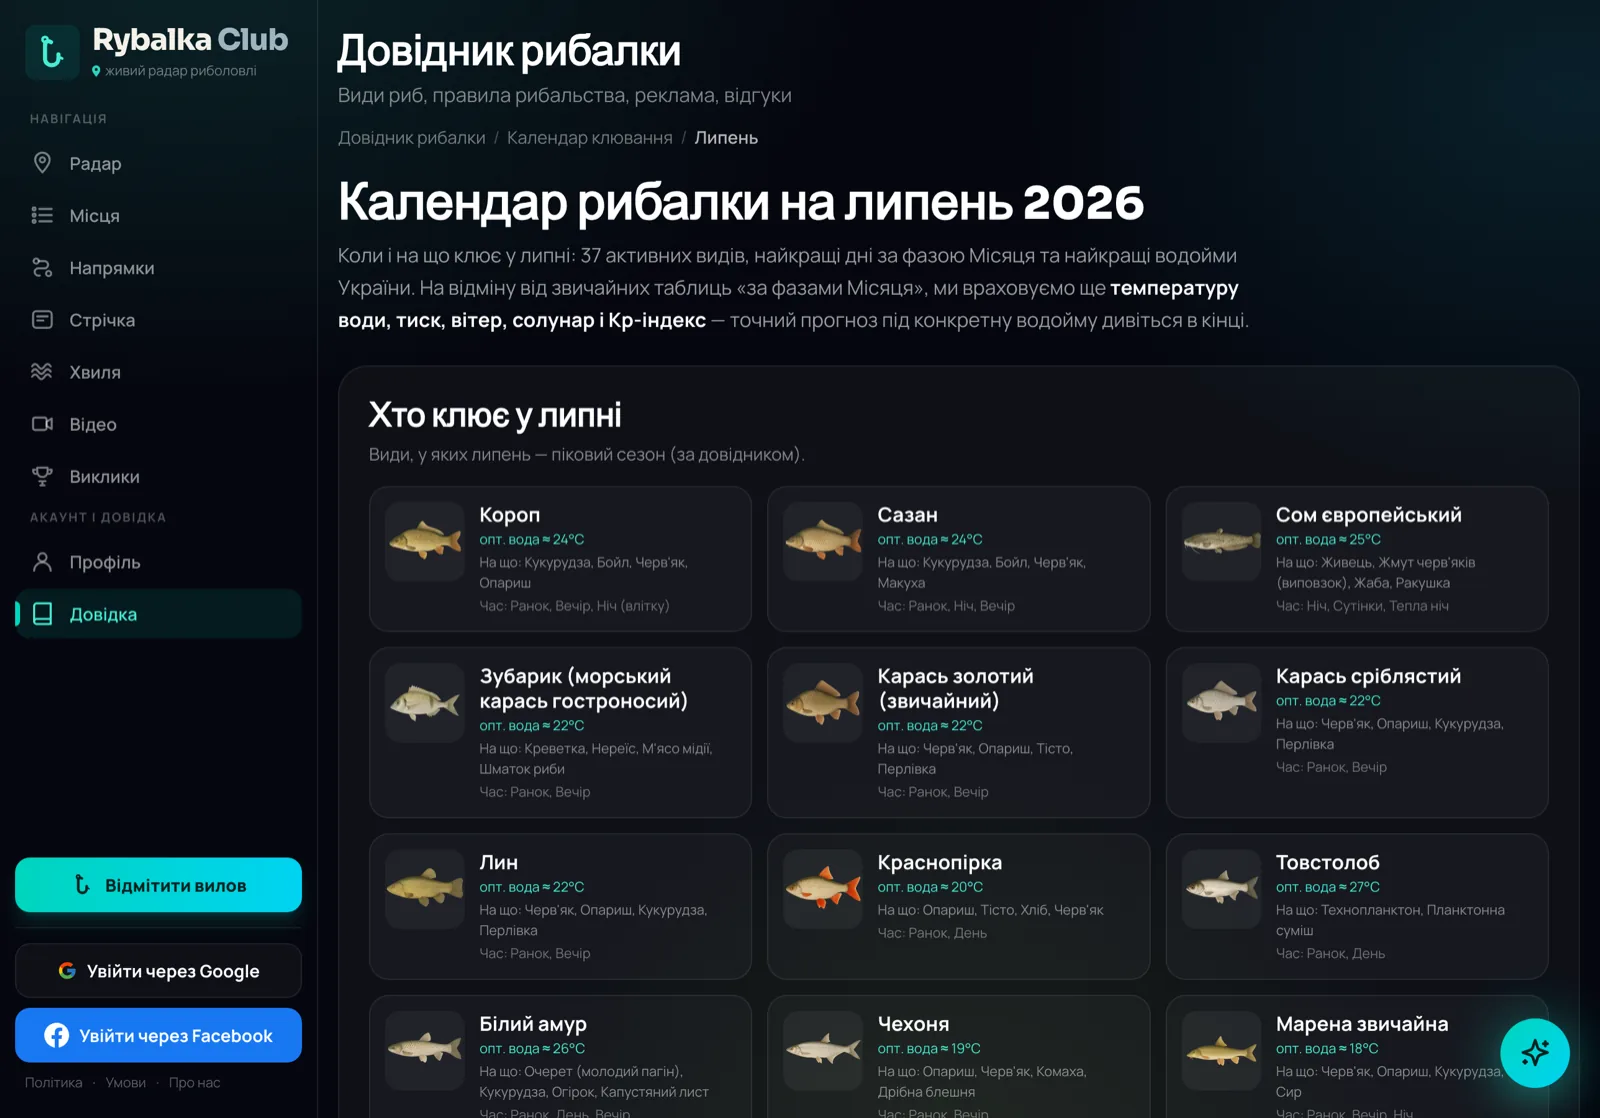
- seasonW — the species’ seasonal activity by month (peak = 1, neighbouring months lower) from the handbook.
Only species that are actually caught at that spot are shown.
Where the numbers come from
Real, open data — no invented signals. Everything is tied to the spot’s coordinates.
The evidence base
The forecast is a weighted heuristic, not a promise. The factors differ in how well science actually backs them — so I weight them accordingly.
- Atmospheric pressure and its sharp changes
- Water temperature
- Season and time of day (dawn / dusk)
- Moon phase and solunar periods — controlled studies show no consistent effect
- Wind direction — mostly an angler’s folk sign
How it’s built
A small, cached Symfony service on top of open weather data — fast, transparent, and easy to reason about.
Want something like this?
A scoring model, a forecast, or any feature that has to be transparent and defensible — tell me the problem and I’ll build it so you can explain every number.